

SAP Business Systems | Analytics & Automation | Databricks
Reporting built around how the business actually works
Every business runs differently, and its reporting should reflect that. I turn existing data, disconnected systems and complicated processes into practical tools designed around how people really work. Most of the time the data is already there, in the ERP or in someone’s spreadsheet. It just needs to be standardized and put to work.
With a background in accounting, operations, analytics and technology, I understand both the business problem and the technical possibilities. In practice, that’s meant integrating data from multiple sources, automating manual processes, building custom apps and designing reports people trust.
Here are the tools I use every day.
Power BI / Power Query
Replaced reports that were rebuilt by hand every month with automated Power BI refreshes, so teams work from one shared source instead of their own copies full of VLOOKUPs and SUMIFs.
Databricks
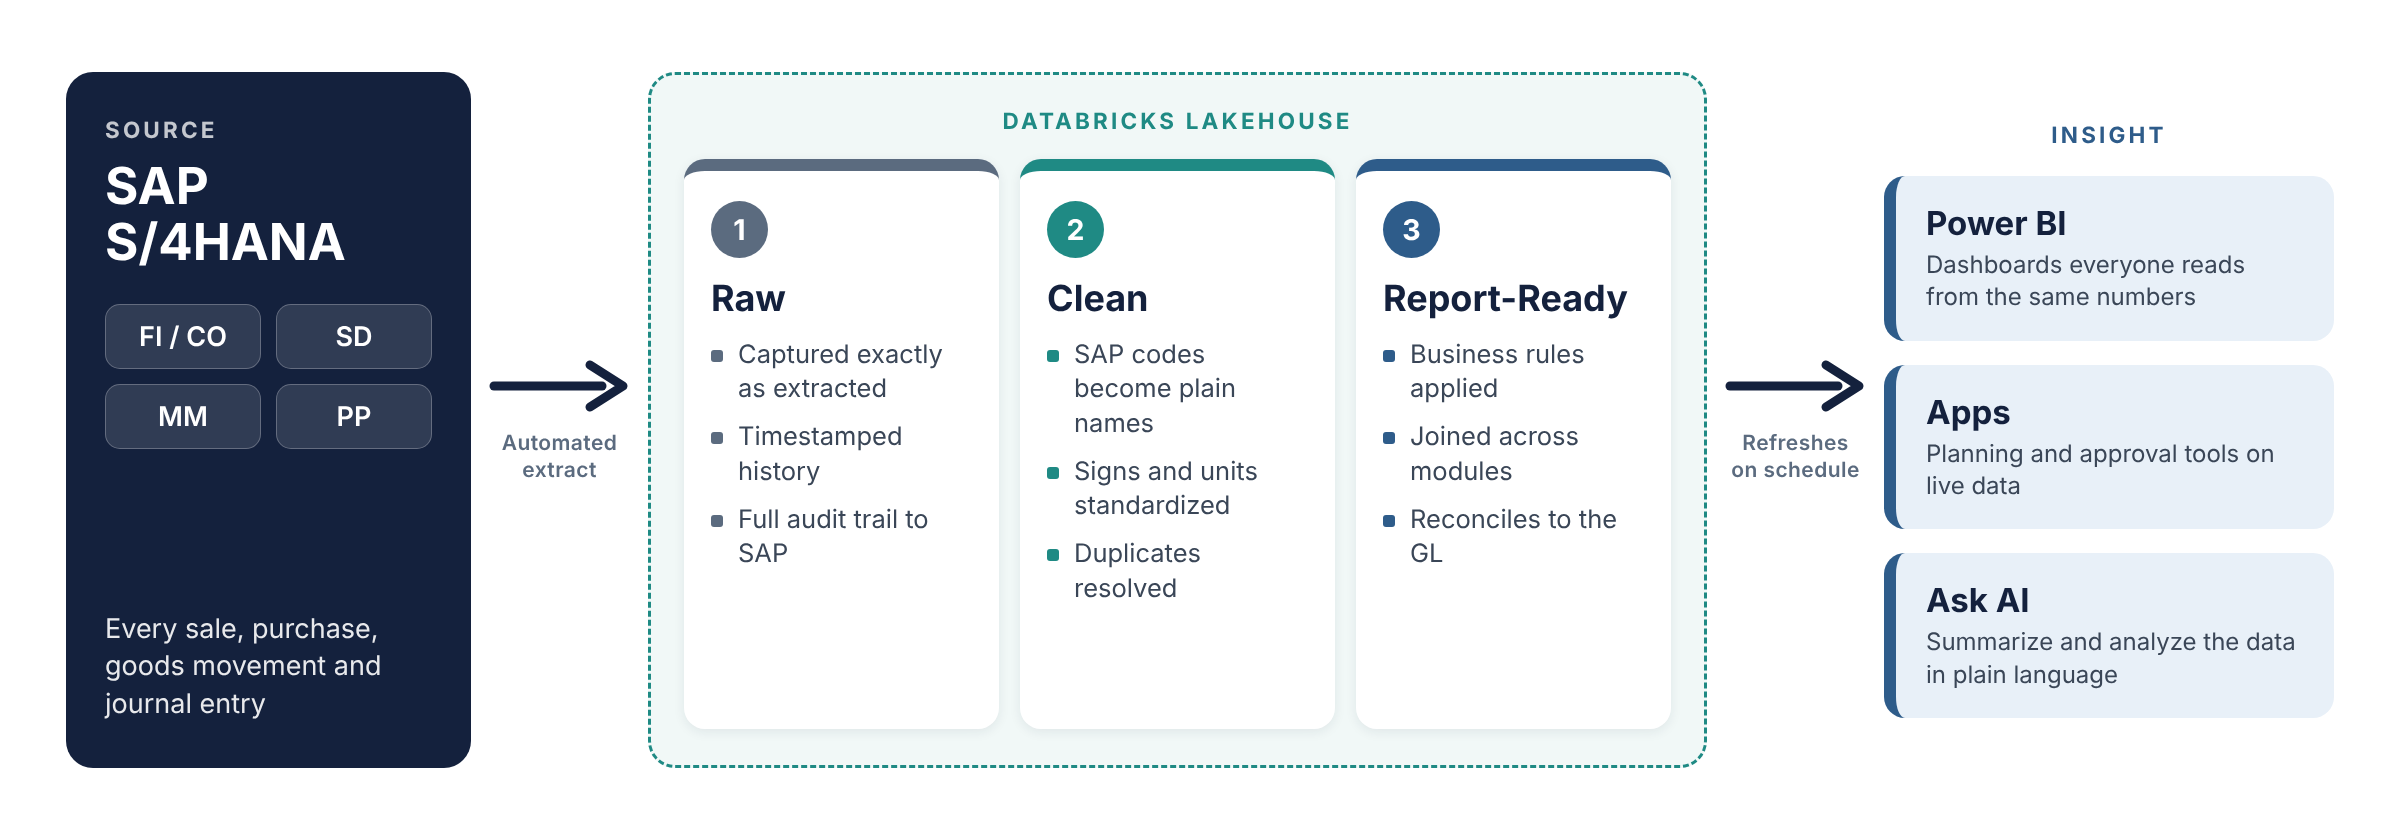
Built a Databricks lakehouse on Azure from the ground up: Unity Catalog governance, raw, clean and report-ready data layers, scheduled pipelines, and Genie spaces where leadership can ask questions of the data in plain English.
Power Apps
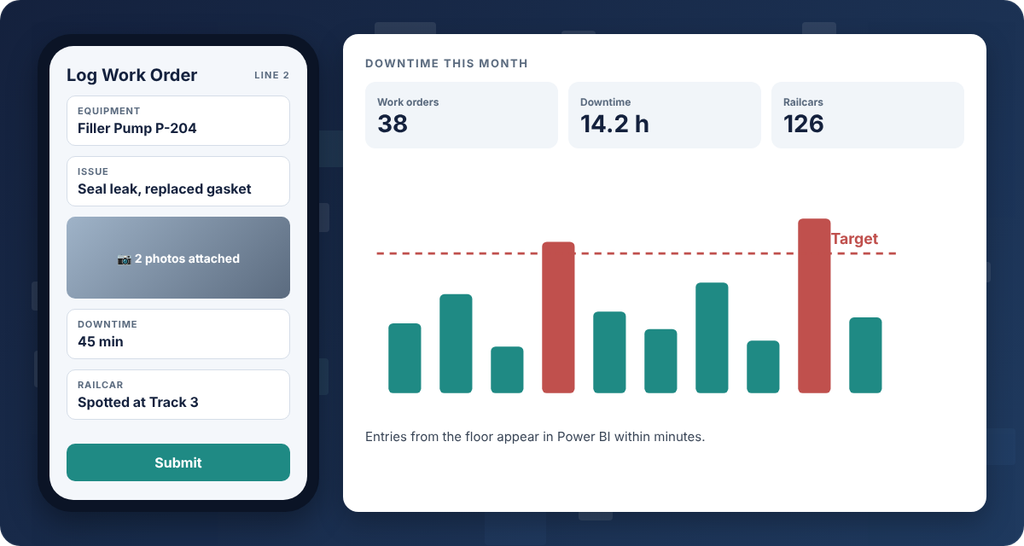
Built mobile apps that replaced paper forms and scattered spreadsheets, sending data entered on the floor straight into the Power BI reports management uses.
Data Modeling & SQL
Design data models and SQL views around what actually drives the business, not just what was easy to export, so the numbers on every report reconcile back to the GL.
Python
Forecasting, regression, categorization and custom apps, including a capacity scheduling app with approval workflows and automated builds of the annual budget template.
Power Automate
Automated file transfers, approvals and email workflows, and used Power Automate as a low-cost way to move ERP and outside data before a full pipeline was in place.
SAP & Enterprise Data Integration
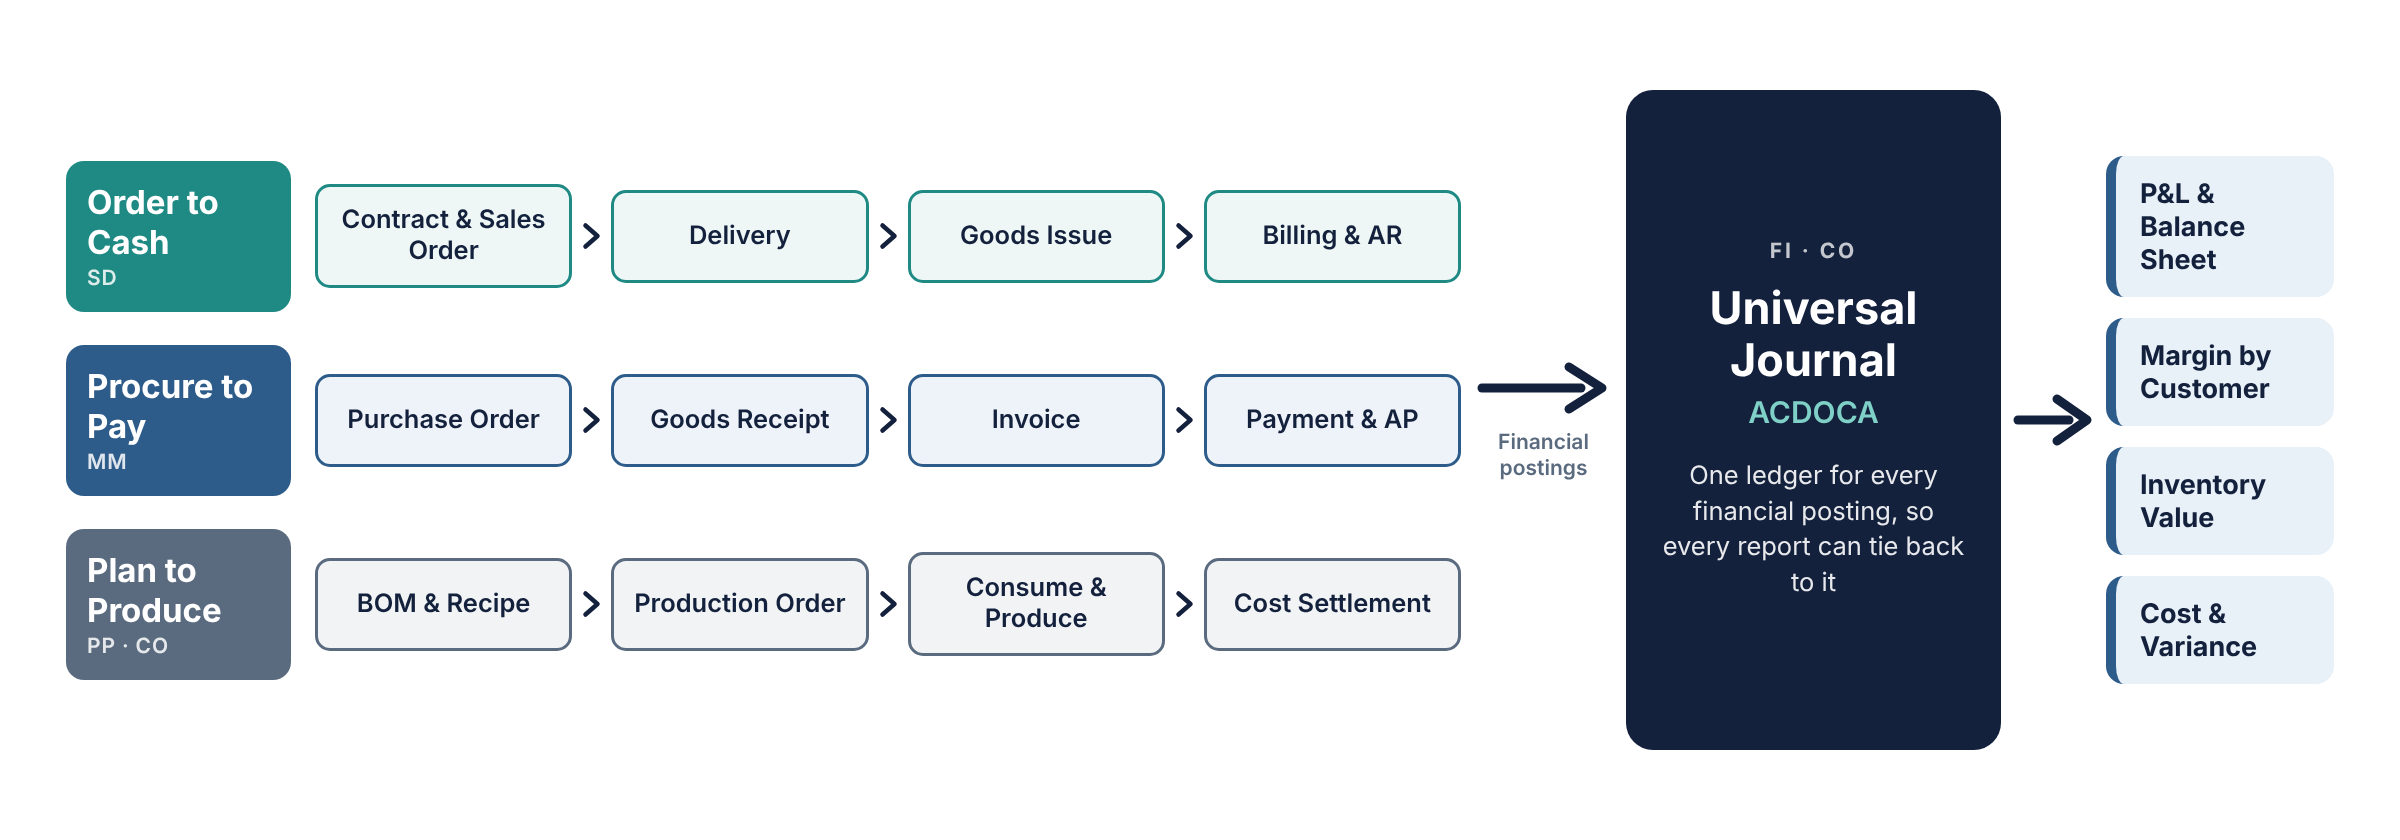
SAP S/4HANA records every transaction a business makes, but it was built to run operations, not to report on them. I’ve worked in S/4HANA since 2018 as a data analyst, master data owner and data analytics lead, always with an accountant’s perspective. I know which tables matter, how they join, how data flows between modules, and why the report doesn’t match the ledger.
Finance & GL Reporting
GL, P&L and margin reporting built straight from the SAP universal journal (ACDOCA) that ties back to SAP, plus a cash flow statement reconciliation and report template. Built by an accountant, so it balances.
SAP Data Extraction
Chose the SAP tables and views to extract, wrote view specifications for ABAP developers, and set up automated change-data loads into Databricks so reports refresh on their own instead of waiting on an export.
Master Data
Loaded all customer, business partner and material master data across Dev, QA and Production for an S/4HANA upgrade. I maintain materials, BOMs, recipes and cost estimates – including costing new materials.
Sales, Contracts & Margin
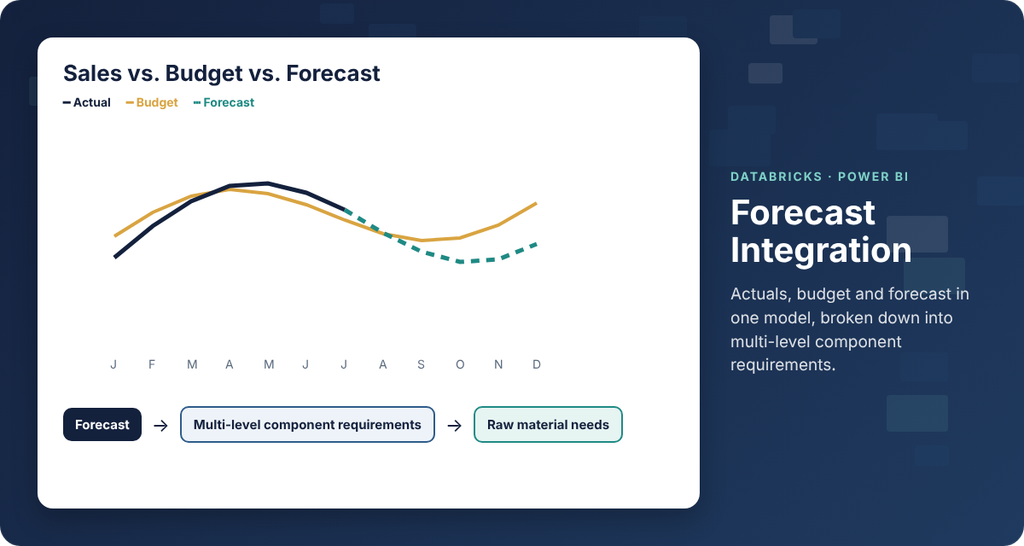
Joined contracts, orders, deliveries and billing into one view: open contracts, sales vs. budget vs. forecast, and margin by customer and material.
Inventory & Production
Daily and month-to-date inventory reconciliations from goods movements, production variance reporting, and BOM explosions that turn sales forecasts into raw material requirements.
Recreating SAP Reports
Rebuilt SAP reports such as customer line items (FBL5N) and credit exposure as automated, shareable reports with documented logic, so they don’t depend on one person knowing which t-code to run.
SAP-to-Databricks Data Platform
Here’s what putting existing ERP data to better use looks like. Using SNP Kyano Glue and AI-assisted development, I designed and built an enterprise-grade data platform from scratch, making SAP S/4HANA data one governed source for the whole business.
From SAP extraction through governed data layers to reports, apps and AI-powered tools, the platform gives people the information they need, in the ways they need to use it.
What I Built
- Automated change-data loads from SAP S/4HANA, with sales and finance data refreshing hourly
- Raw, clean and report-ready data layers, with Unity Catalog organizing data by company and environment
- Scheduled pipelines with task dependencies, so downstream reports never run on stale data
- Power BI reports, Databricks Apps and Genie AI spaces, all reading from the same tables
Why It Matters
- Replaced manual SAP exports and spreadsheet reports with data that refreshes on its own
- Finance, sales and operations work from one set of numbers that reconciles to the GL
- Governed access with service principals, a locked-down production workspace and break-glass admin coverage
- Leadership can ask complicated questions of the data in plain English with AI instead of waiting on a custom report
Selected Projects
The platform is the foundation, but it’s only part of the story. These are a few of the tools built on it and alongside it, each one designed to solve a specific problem for the people who use them every day. And there’s always another one to build!
Illustrative images only. Company data not shown.
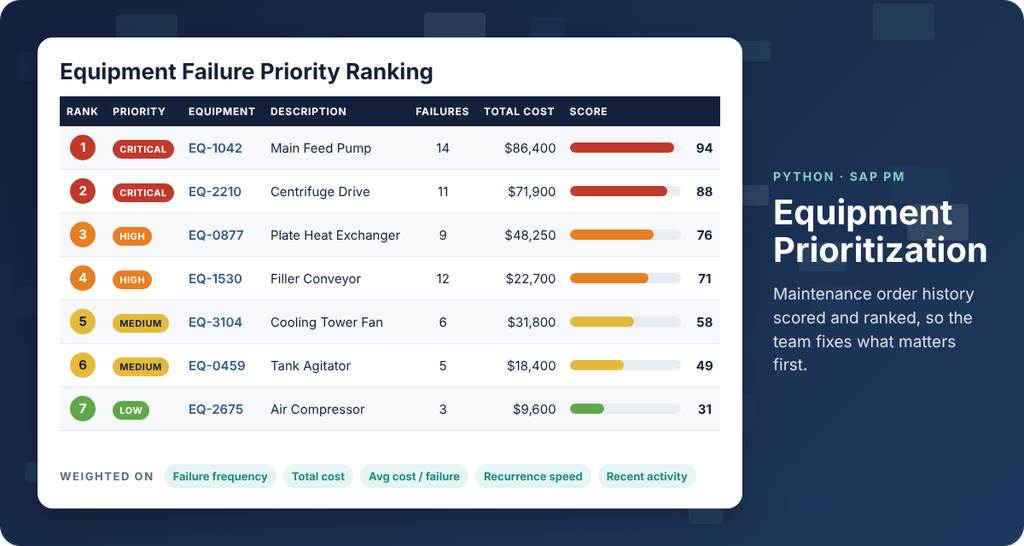
Equipment Failure Prioritization
Python
Scores every piece of equipment from SAP maintenance order history (IW38) on failure frequency, total and average repair cost, how quickly failures come back, and recent activity, then produces a color-coded Excel ranking so maintenance knows where to focus first.
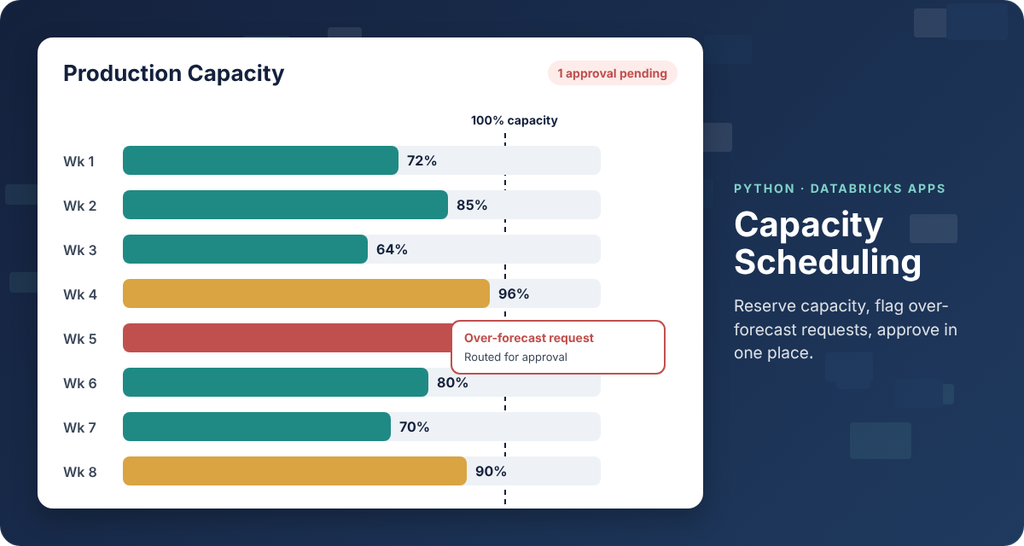
Capacity Scheduling & Approvals App
Python / Databricks Apps
A planning app where users reserve production capacity, with alerts for over-capacity requests and an approval workflow for over-forecast and early-draw orders, all on live data.
Maintenance & Downtime Logging
Power Apps
A mobile app for logging maintenance work with photos, tracking railcar movements and recording downtime, with the data flowing straight into reporting.
Sales, Budget & Forecast Integration
Databricks / Power BI
Combined actual sales, the annual budget and rolling forecasts into one model, then broke the forecast down into multi-level component requirements so purchasing can buy raw materials ahead of demand.
About Me
I’m a data analytics and business systems professional with a background in accounting, operations, and applied data science. I specialize in bridging the gap between business needs and technology, turning complicated processes and disconnected data into practical, automated solutions.
From building Power BI reporting systems to developing an Azure Databricks lakehouse from the ground up, I’ve managed the entire process—from understanding business requirements and designing solutions to implementation, training, and ongoing support.
- Business & Accounting Foundation. B.S. in Accounting and experience as a staff accountant. I understand financial reporting, reconciliations and profitability analysis, so I build reports that reconcile to the GL and the balance sheet, not just reports that look good.
- Data Science & Analytics. M.S. in Applied Data Science from Syracuse University, with experience in forecasting, automation, data modeling, and business intelligence.
- SAP S/4HANA & Business Systems. Hands-on experience since 2018 across finance, sales, materials management, and master data, from SQVI queries to ERP upgrades, process improvements, and systems integration.
- Data Engineering & Automation. Designed and built an Azure Databricks lakehouse from the ground up: automated SAP data pipelines, governed reporting layers, business apps and Genie spaces for AI-powered analytics.
- U.S. Army Veteran. Ten years of active-duty service, bringing leadership, adaptability, and a mission-focused approach to problem-solving.